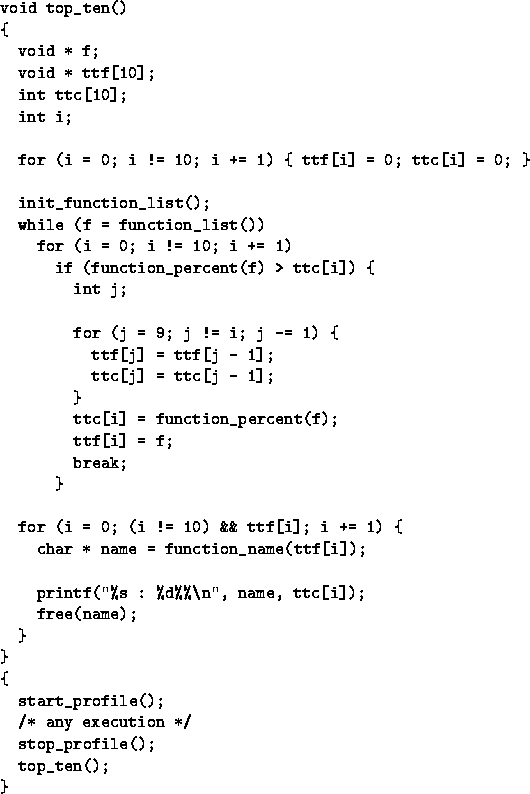
Profiling helps you to approximately know the run time ratio taken by your functions. Built-in functions are not taken into account and their run time are included in their caller's one. To achieve this you must call startprofile(), execute your program, and last call stopprofile(). After that functionpercent() may return run time percentages.
When profile is running, a timer is used to watch periodically which function is the current function, and to increase its counter. If is used from , this timer is disarmed when you are under the toplevel, but it remains active when you call an interface function from .
To see the ten most greedy functions (the topten function is defined in the topten.sc file), you can run:

Resets counters, starts the profiling and returns the number of not built-in functions.
Stops profiling and returns the amount of time the timer has run.
Takes a function as argument and returns its execution profile associated counter, and 0 if the timer has never run (run time was too small) or if the function is built-in.